


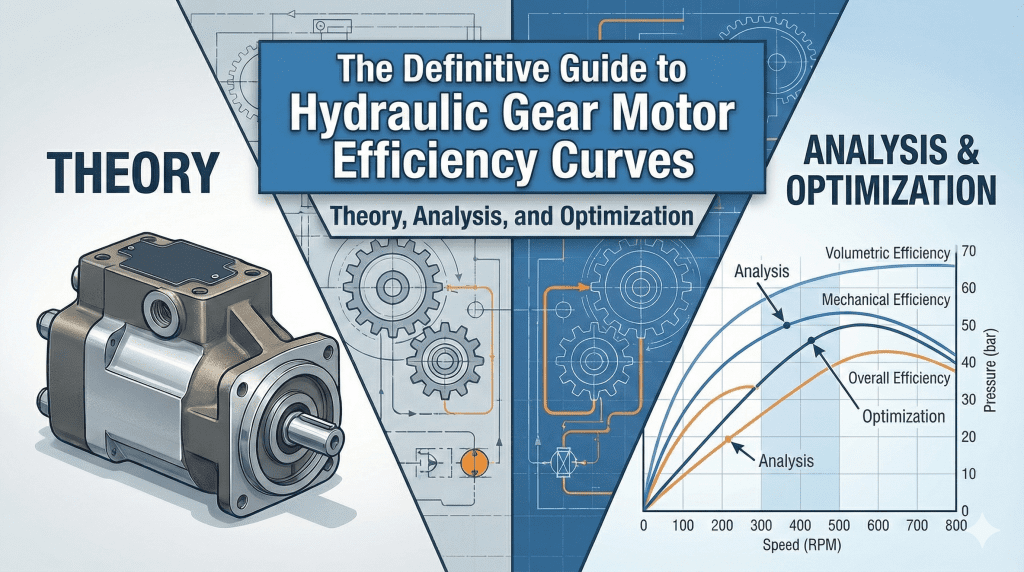
The Definitive Guide to Hydraulic Gear Motor Performance Curves: Theory, Analysis, and Optimization
1. Introduction: The Critical Role of the Hydraulic Gear Motor Performance Curve
In the intricate world of fluid power systems, the hydraulic gear motor stands as a ubiquitous workhorse. Renowned for its durability, cost-effectiveness, and power density, it powers everything from agricultural conveyors and construction winches to industrial injection molding machines. However, the successful deployment of these components relies not merely on their mechanical robustness but on a precise understanding of their performance characteristics. At the heart of this understanding lies the hydraulic gear motor performance curve—a complex, multi-dimensional map that defines the relationship between input energy and output work.
For hydraulic system designers, maintenance engineers, and procurement specialists, the performance curve is more than a datasheet artifact; it is the blueprint for energy sustainability and operational reliability. A nuanced interpretation of these curves allows for the optimization of prime movers, the minimization of thermal loads, and the prediction of component lifecycles.1 As industries increasingly move toward energy-efficient, “smart” hydraulic systems, the ability to analyze and optimize based on the hydraulic gear motor performance curve has become a prerequisite for engineering excellence.
This comprehensive report provides an exhaustive analysis of the hydraulic gear motor performance curve. We will dissect the theoretical physics governing torque and flow, explore the tribological factors influencing mechanical loss, and provide actionable strategies for using these curves to diagnose system health and optimize performance.
2. Fundamentals of Hydraulic Gear Motor Operation
To interpret an performance curve, one must first possess a deep, first-principles understanding of how a gear motor functions. Unlike a pump, which converts mechanical torque into fluid power, the gear motor performs the inverse operation: it converts fluid potential energy (pressure) and kinetic energy (flow) into mechanical rotary power (torque and speed).
2.1 The Mechanism of Torque Generation
The fundamental mechanism of the external gear motor involves two meshed gears—a drive gear and an idler gear—housed within a precision-machined casing. Pressurized fluid enters the inlet port and is blocked from flowing directly to the outlet by the meshing point of the gear teeth. Instead, the fluid pressure acts upon the exposed surface area of the gear teeth.
The theoretical torque ($T_{th}$) generated is a function of the displaced volume and the pressure differential, governed by the following equation:
$$T_{th} = \frac{V_g \cdot \Delta P}{20 \cdot \pi}$$
Where:
- $T_{th}$ = Theoretical Torque (Nm)
- $V_g$ = Geometric Displacement (cm³/rev)
- $\Delta P$ = Pressure Differential (bar)
This equation reveals a linear relationship: as pressure increases, torque should increase proportionally. However, the hydraulic gear motor performance curve reveals that this relationship is never perfectly linear in practice due to mechanical inefficiencies.3
2.2 The Mechanism of Speed Generation
The rotational speed of the motor is determined by the volume of fluid passing through the expanding and contracting chambers formed by the gear teeth and the housing. Ideally, every unit of fluid volume would correspond to a specific degree of rotation.
The theoretical speed ($N_{th}$) is calculated as:
$$N_{th} = \frac{Q_{in} \cdot 1000}{V_g}$$
Where:
- $N_{th}$ = Theoretical Speed (rpm)
- $Q_{in}$ = Input Flow Rate (L/min)
- $V_g$ = Geometric Displacement (cm³/rev)
In reality, fluid slippage (internal leakage) means that the actual speed is always lower than the theoretical speed for a given flow rate. This discrepancy is the domain of volumetric performance, a primary component of the overall performance curve.4
3. Deconstructing the Performance Curve: The Two Pillars of Loss
The term “performance curve” is often a simplification. It is, in fact, a composite of two distinct performance metrics that behave in opposing ways relative to operating parameters like viscosity and speed. Understanding the dichotomy between Volumetric Performance and Mechanical Performance is essential for interpreting the overall performance map.
3.1 Volumetric Performance ($\eta_v$): The Leakage Landscape
Volumetric performance is the measure of how effectively the motor contains the pressurized fluid and forces it to perform work, rather than allowing it to bypass the gears via internal leakage paths.
3.1.1 Calculating $\eta_v$
For a hydraulic motor, volumetric performance is defined as the ratio of the theoretical flow required to produce a given speed, to the actual flow consumed. Alternatively, it is the ratio of actual speed to theoretical speed at a fixed flow rate.
$$\eta_v = \frac{N_{actual}}{N_{theoretical}} \times 100$$
3.1.2 The Physics of Leakage
In a gear motor, leakage occurs across three primary interfaces:
- Tip Clearance:The gap between the tips of the gear teeth and the internal housing wall.
- Side Clearance (Axial):The gap between the side faces of the gears and the bushings or wear plates.
- Mesh Point:The contact point between the driving and idler gears.
The flow through these gaps acts like flow through an orifice or a parallel plate slot. According to fluid dynamics principles, this leakage flow ($Q_{leak}$) is directly proportional to the pressure differential ($\Delta P$) and inversely proportional to the fluid viscosity ($\mu$).
3.1.3 The Volumetric Performance Curve Profile
On a standard hydraulic gear motor performance curve:
- Effect of Pressure:As pressure increases, $\eta_v$ decreases linearly or exponentially. High pressure drives more fluid through the fixed clearances, resulting in greater “slip” and lower output speed.
- Effect of Speed:At very low speeds, $\eta_v$ can be poor because the leakage time-per-revolution is high. As speed increases, the leakage remains relatively constant in time, but becomes a smaller percentage of the total swept volume, often causing the curve to flatten or slightly improve.
- Effect of Viscosity:Low viscosity fluids (due to heat or fluid type) significantly lower the volumetric performance This is why a motor that performs well at 40°C may stall or slow down significantly at 80°C.
3.2 Mechanical Performance ($\eta_{hm}$): The Friction Landscape
Mechanical performance (also referred to as hydro-mechanical performance) measures the torque losses due to friction within the motor. It represents the percentage of theoretical torque that is actually available at the output shaft.
3.2.1 Calculating $\eta_{hm}$
$$\eta_{hm} = \frac{T_{actual}}{T_{theoretical}} \times 100$$
3.2.2 Sources of Mechanical Loss
Mechanical losses in gear motors arise from distinct physical phenomena:
- Coulomb Friction:Metal-to-metal or boundary-lubricated contact at the bearings, seals, and gear mesh. This is load-dependent and dominant at low speeds (static friction).
- Viscous Drag:The resistance of the fluid to shearing as the gears rotate. This is speed-dependent. As the gears spin faster, they must shear the oil film at a higher rate, generating heat and consuming torque.
- Churning Losses:At high speeds, the turbulence generated by the gears spinning in the fluid creates significant hydrodynamic resistance.
3.2.3 The Mechanical Performance Curve Profile
- Effect of Speed:$\eta_{hm}$ typically decreases as speed increases due to rising viscous drag and churning losses.
- Effect of Pressure:$\eta_{hm}$ often improves with pressure. While friction increases with load, the percentage of torque lost to friction becomes smaller relative to the total torque output, up to a point where bearing loads become excessive.
- Starting Torque:The curve originates at zero speed with the “Starting Torque” or “Breakaway Torque.” This is often only 70-80% of theoretical torque due to the high coefficient of static friction (stiction).
3.3 Overall Performance ($\eta_t$)
The total or overall performance is the product of the volumetric and mechanical efficiencies:
$$\eta_t = \eta_v \times \eta_{hm}$$
This relationship creates a “hill” or “dome” shape in the performance map. The Best Performance Point (BEP) occurs where the product of the two variables is maximized—typically at medium speeds (where leakage is a small fraction of flow, but viscous drag isn’t yet severe) and medium-to-high pressures.
4. Analyzing the Iso-Performance Map (The Muschel Diagram)
While simple 2D plots (e.g., Flow vs. Pressure) are useful, the industry standard for comprehensive analysis is the Iso-Performance Contour Map, often called the “Muschel diagram” (shell diagram) due to its concentric, shell-like shape.
4.1 Reading the Map
- X-Axis:Rotational Speed (rpm).
- Y-Axis:Torque (Nm) or Differential Pressure ($\Delta P$).
- Contours:These lines connect points of equal overall performance (e.g., 60%, 70%, 80%, 85%).
- The “Eye”:The center of the concentric circles represents the peak performance For external gear motors, this “sweet spot” is usually in the range of 1000-2000 rpm and 100-200 bar, depending on displacement.
4.2 Operating Regions and Implications
- The High-Pressure/Low-Speed Corner:
- Characteristics:High torque demand but slow rotation.
- PerformanceState: High pressure causes maximum leakage ($\eta_v$ drops), while low speed prevents hydrodynamic lubrication films from forming fully, increasing boundary friction.
- Risk:This is the “stall” danger zone. Heat generation is high because leakage flow across a high-pressure drop adds significant energy to the fluid without producing work.
- The High-Speed/Low-Pressure Corner:
- Characteristics:Fast rotation with light load.
- PerformanceState: While leakage is minimal (low pressure), viscous drag is maximized (high speed). The motor is expending most of its energy just to spin itself and shear the oil.
- Risk:Cavitation and aeration. If the inlet line cannot supply fluid fast enough, the vacuum at the gear inlet will cause vapor bubbles to form, destroying the motor internals.
- The Continuous Duty Zone (The Eye):
- Characteristics:Balanced speed and pressure.
- PerformanceState: Leakage is manageable; lubrication is fully hydrodynamic (low friction).
- Strategy:System designers should size the motor displacement and gearing so that the machine’s primary duty cycle falls within this 85%+ performance
5. The Impact of Fluid Properties on the Performance Curve
The hydraulic fluid is not merely a medium; it is a structural component of the motor. Its properties, particularly viscosity and temperature, fundamentally alter the hydraulic gear motor performance curve.
5.1 Viscosity: The Double-Edged Sword
Viscosity ($\nu$) is the measure of a fluid’s resistance to flow. Its impact on the performance curve is paradoxical, creating a trade-off that must be managed carefully.
- High Viscosity (Cold Oil):
- Volumetric Effect:Improves $\eta_v$. Thick oil seals the internal clearances effectively, reducing slip.
- Mechanical Effect:Degrades $\eta_{hm}$. Thick oil is harder to shear, increasing viscous drag and churning losses. It significantly increases the starting torque requirement, potentially preventing the motor from moving under load in winter conditions.
- Curve Shift:The performance map shifts toward higher performance at lower speeds but penalizes high-speed operation.
- Low Viscosity (Hot Oil):
- Volumetric Effect:Degrades $\eta_v$. Thin oil flows easily through leakage paths. This causes the “speed droop” curve to steepen; for every bar of pressure increase, the motor loses more rpm than it would with cold oil.
- Mechanical Effect:Improves $\eta_{hm}$. Thin oil offers little resistance to rotation, reducing drag.
- Curve Shift:The operating window narrows. The motor may not be able to build high pressures because the leakage rate equals the input flow rate (stalling the motor hydraulically).
5.2 The Stribeck Curve Connection
The relationship between friction coefficient, viscosity ($\mu$), speed ($N$), and load ($P$) is described by the Stribeck curve, defined by the Hersey number ($\frac{\mu N}{P}$).
- Boundary Lubrication (Low $\frac{\mu N}{P}$):At startup or low speeds/high loads, the gear teeth and bearings ride on asperities. Friction is high. This corresponds to the low-speed region of the performance
- Mixed Lubrication:As speed increases, a film begins to form. Friction drops rapidly.
- Hydrodynamic Lubrication (High $\frac{\mu N}{P}$):The surfaces are fully separated by an oil wedge. Friction is low and linear. This corresponds to the linear portion of the mechanical performance
5.3 Compressibility (Bulk Modulus)
While liquids are often assumed incompressible, hydraulic oil compresses about 0.5% per 1000 psi. In high-pressure gear motors, this compressibility acts like a “spring,” absorbing flow volume without producing rotation. This effectively reduces volumetric performance, particularly in large displacement motors operating at high pressures. Aeration (air bubbles) drastically reduces bulk modulus, making the performance curve erratic and “spongy”.
6. Sizing and Selection: Using the Curve for Design
The primary utility of the hydraulic gear motor performance curve is in the selection process. A correctly sized motor operates in the “eye” of the performance map; an incorrectly sized one operates in the corners, wasting energy and failing prematurely.
6.1 Matching Motor to Load Requirements
- Define the Load Torque:Determine the running torque and the breakaway (starting) torque required by the application.
- Critical Check:Ensure the motor’s starting torque (derived from the 0 rpm point on the T-N curve) exceeds the load’s breakaway torque. Remember, a motor rated for 100 Nm may only deliver 70 Nm at startup.
- Define the Speed Range:Identify the minimum and maximum required rpm.
- Overlay on PerformanceMap: Plot the load points (Torque vs. Speed) onto the motor’s Muschel diagram.
- If the points fall in the <60% performancezones, consider a different displacement or a different motor type (e.g., piston).
- If the operating point is near the maximum pressure rating, the motor lifespan will be short. Gear motors are typically rated for intermittent peak pressure and continuous rated pressure. Operating continuously at the peak rating on the performancecurve results in rapid thermal degradation.
6.2 Calculating Power Input
Using the performance values from the curve, the required hydraulic power ($P_{hyd}$) can be calculated more accurately than by using theoretical formulas alone:
$$P_{hyd} (kW) = \frac{T_{load} (Nm) \cdot N (rpm)}{9550 \cdot \eta_t}$$
Where $\eta_t$ is the overall performance (decimal) taken from the curve at that specific operating point. Ignoring $\eta_t$ often leads to undersizing the prime mover (electric motor or diesel engine), causing the system to bog down under load.
7. Troubleshooting and Maintenance via Curve Analysis
The performance curve is a diagnostic baseline. When a hydraulic system acts up, comparing its current performance to the “as-new” performance curve can pinpoint the root cause.
7.1 Diagnosing Wear (The “Slip” Test)
As gear motors wear, the internal clearances increase due to abrasion or erosion. This permanently alters the volumetric performance curve.
- Symptom:The machine works fine when cold but slows down or loses power when hot.
- Curve Analysis:This indicates that the viscosity drop (due to heat) combined with the widened gaps (wear) has pushed the volumetric performance below a critical threshold.
- The Test:Lock the motor shaft (mechanically) and apply pressure (carefully). Measure the flow coming out of the drain or outlet. If this “case drain flow” is significantly higher than the manufacturer’s leakage curve specifies for that pressure, the motor is worn out.
7.2 Diagnosing Overheating
Heat is the physical manifestation of inperformance.
$$Heat Generation (kW) = P_{input} \cdot (1 – \eta_t)$$
If a system is overheating:
- Check the operating point on the curve. Is the motor running at high pressure and very low speed? This is a naturally inefficient zone.
- Check for internal recirculation. If $\eta_v$ has dropped from 90% to 70%, that missing 20% of hydraulic power is being converted directly into heat across the leakage restrictions. This creates a thermal runaway cycle: leakage causes heat $\rightarrow$ heat lowers viscosity $\rightarrow$ lower viscosity causes more leakage.
7.3 Diagnosing Low Speed (Speed Droop)
If the motor runs slower than calculated:
- Check the Q-P (Flow vs. Pressure) curve. Does the speed drop align with the expected slip for that pressure?
- If the speed drop is steeperthan the curve, check for internal seal failure or a relief valve that is cracking open prematurely.
- If the speed is low but consistent regardless of load, check the pump supply or inlet restrictions (starvation).
8. Comparative Analysis: Gear vs. Vane vs. Piston Motors
To fully contextualize the hydraulic gear motor performance curve, it is helpful to compare it with other hydraulic motor technologies.
|
Feature |
External Gear Motor |
Vane Motor |
Axial Piston Motor |
Radial Piston Motor |
|
Peak $\eta_t$ |
70% – 85% |
75% – 85% |
85% – 95% |
90% – 96% |
|
Volumetric $\eta_v$ |
80% – 90% |
85% – 92% |
90% – 98% |
95% – 99% |
|
Mechanical $\eta_{hm}$ |
85% – 90% |
85% – 92% |
90% – 95% |
90% – 95% |
|
Low Speed Capability |
Poor (< 500 rpm cogging) |
Fair |
Good |
Excellent |
|
Start Torque Performance |
70% – 80% |
75% – 85% |
80% – 90% |
90% – 95% |
|
Cost |
Low |
Medium |
High |
Very High |
|
Contamination Tolerance |
High |
Low |
Low |
Medium |
Analysis:
- Gear Motors:Have a flatter, less aggressive performance They maintain “good enough” performance over a wide range but rarely hit the >95% peaks of piston motors. Their curve drops off steeply at very low speeds due to leakage.
- Piston Motors:Have a very high, narrow performance They are superior for high-pressure, high-power applications but are far less tolerant of contamination.
- Selection:Use gear motors where cost is a driver and duty cycles are intermittent or moderate. Use piston motors where energy performance is paramount (e.g., battery-powered mobile hydraulics).
9. Advanced Topics: Electro-Hydraulic Integration
In the era of Industry 4.0, the static performance curve is being digitized. Modern electro-hydraulic systems use Variable Frequency Drives (VFDs) to control the prime mover speed.
9.1 Variable Speed Drives (VSD) and Performance Maps
By coupling a gear motor to a VFD-driven pump, controllers can dynamically adjust the flow to keep the motor operating closer to its BEP.
- Algorithm:The controller monitors pressure and speed sensors. It references a digitized look-up table of the motor’s performance
- Optimization:If the motor enters a low-performance zone (e.g., high speed, low pressure), the system can adjust the pump displacement or motor speed (if variable) to shift the operating point back into the “eye” of the Muschel diagram.
9.2 The Impact of “Quiet” Gear Technologies
Newer gear tooth profiles (such as continuous contact helical gears) are designed primarily for noise reduction but also impact the performance curve. These designs often reduce the flow ripple (pulsation), which improves the volumetric performance stability at lower speeds, effectively widening the usable range of the performance curve.
10. Summary and Conclusion
The hydraulic gear motor performance curve is the fundamental truth of the component’s performance. It is a rigorous mathematical and empirical statement of how the motor handles energy.
- Volumetric performancetells the story of containment—how well the motor seals fluid under pressure. It is the primary victim of wear, heat, and high pressure.
- Mechanical performancetells the story of friction—how much energy is lost to the physical interactions of metal and fluid. It is the primary victim of high speed and cold startups.
- Overall performanceis the balance of these two forces.
For the engineer, the goal is not to find a motor with 100% performance, as that violates the laws of physics. The goal is to overlay the machine’s duty cycle onto the motor’s performance map and ensure that the vast majority of its operating life is spent in the high-performance islands. Doing so results in systems that run cooler, last longer, and consume less energy.
As hydraulic technology evolves, the static curve is becoming a dynamic digital twin, allowing real-time optimization. Yet, the physical principles—the battle between leakage and friction—remain unchanged. Mastering these principles is the hallmark of a true fluid power expert.
11. Frequently Asked Questions (FAQ)
Q1: Why does the hydraulic gear motor performance curve drop at high pressures?
A: The drop in overall performance at high pressures is primarily driven by a decrease in volumetric performance. As the pressure differential ($\Delta P$) between the inlet and outlet increases, the force driving fluid through the internal clearance gaps (tip clearance and side clearance) increases. This results in more fluid bypassing the gears (slip) rather than turning them. While mechanical performance might remain stable or even slightly improve as a percentage, the loss of fluid volume to leakage dominates, causing the overall performance to decline.
Q2: How does temperature affect the hydraulic gear motor performance curve?
A: Temperature affects the curve by altering the viscosity of the hydraulic fluid.
- High Temperature:Lowers viscosity. This increases internal leakage, causing the volumetric performance curve to drop significantly. The motor may slow down or stall under load. However, mechanical performance may improve due to reduced viscous drag.
- Low Temperature:Increases viscosity. This improves sealing (higher volumetric performance) but significantly increases fluid friction (viscous drag), lowering mechanical performance and requiring much higher starting torque.
Q3: What is “Stall Torque Performance” and why is it lower than running performance?
A: Stall torque performance refers to the ratio of torque the motor can generate at zero rpm (breakaway) compared to its theoretical torque. It is typically only 70-80% for gear motors. This is lower than running performance because the motor must overcome static friction (stiction) between the gears, bearings, and seals. Once the motor starts spinning, a hydrodynamic oil film forms, reducing friction and increasing torque delivery. Designers must size motors based on this lower stall torque value if the load must be started from a dead stop.
Q4: Can I use a standard gear pump performance curve to predict gear motor performance?
A: While the physics are similar, you should not assume they are identical. Gear pumps are optimized to create flow; gear motors are optimized to generate torque. Motors often have different internal tolerancing to handle lower speeds and may have different bearing configurations to handle the side loads generated by the output shaft application (e.g., belt drives). Furthermore, pumps usually operate at a fixed speed (e.g., 1800 rpm), while motors operate across a wide variable speed range. Always use the specific motor curve provided by the manufacturer.
Q5: What is the “corner horsepower” or “corner limit” on an performance map?
A: The “corner” refers to the operating point where maximum pressure and maximum speed coincide. While a motor may be rated for 200 bar and 3000 rpm, operating at both simultaneously (the top right corner of the Q-P chart) places extreme stress on the unit. This zone generates the maximum amount of heat (due to high friction and high leakage flow energy) and imposes the highest loads on bearings. Continuous operation in this “corner” will drastically reduce the motor’s life.
Q6: How do I calculate the actual power required to drive a load using the performance curve?
A: To find the input hydraulic power required ($P_{in}$) to achieve a desired output mechanical power ($P_{out}$):
- Calculate $P_{out} = \frac{Torque \times RPM}{9550}$.
- Locate the operating point (Torque, RPM) on the performancemap to find the overall performance ($\eta_t$).
- Calculate $P_{in} = \frac{P_{out}}{\eta_t}$.Example: If you need 10 kW of mechanical power and the curve shows 80% performance(0.80) at that point, you need to supply $10 / 0.80 = 12.5$ kW of hydraulic power.
Q7: Why is my gear motor running slower than the curve predicts?
A: If the motor is running slower than the theoretical speed adjusted for the manufacturer’s stated volumetric performance, it usually indicates excessive internal leakage. This could be due to:
- Wear:Worn gear tips or side plates have increased the clearance gaps.
- Fluid Issues:The oil is too hot (viscosity too low) or aerated (spongy).
- Pressure:The load is higher than anticipated, pushing the motor further down the slip curve.
- Inlet Restriction:The motor is cavitating, meaning it isn’t receiving a full charge of oil.
Q8: What represents the “Best Performance Point” (BEP) on a Muschel diagram?
A: The BEP is the “bullseye” of the iso-performance contours. For external gear motors, it is typically found at medium-to-high speeds and medium-to-high pressures. In this zone, the motor spins fast enough to form a good lubrication film (low friction) and generate significant power, but not so fast that churning losses take over. Simultaneously, the pressure is high enough to generate good torque, rendering the fixed friction losses a smaller percentage of the total output.
Q9: How does “back pressure” affect the gear motor performance?
A: Gear motors have a case drain or return port. If the return line has high restriction (back pressure), it effectively reduces the pressure differential ($\Delta P$) available to do work.
$Torque \propto (P_{inlet} – P_{outlet})$.
If the inlet is 100 bar and back pressure is 20 bar, the motor only sees 80 bar of effective pressure. This reduces torque output. Furthermore, excessive back pressure can blow out the shaft seal if the case drain isn’t properly plumbed to the tank.
Q10: What is the typical volumetric performance of a new hydraulic gear motor?
A: A high-quality, new external gear motor typically exhibits a volumetric performance of 90% to 95% at its rated conditions. As pressure increases towards the maximum rating, this may drop to 80-85%. If field measurements show volumetric performance below 70-75%, the motor is generally considered due for replacement or overhaul.